Define what healthy means
Choose HTTP methods, expected status codes, timeouts and redirect behavior. Add response text checks or nested JSON rules when a successful status code is not enough.
 UptimeOwl
A WATCHFUL EYE ON EVERY RESPONSE
A reachable endpoint is a good start. A response that does what you expect is better. UptimeOwl checks your monitors, records the results and lets your team know when a confirmed issue needs attention.
Start free. No card required.
Choose HTTP methods, expected status codes, timeouts and redirect behavior. Add response text checks or nested JSON rules when a successful status code is not enough.
Set consecutive failure and recovery thresholds before status changes. Schedule maintenance to keep planned work from becoming an unnecessary alert.
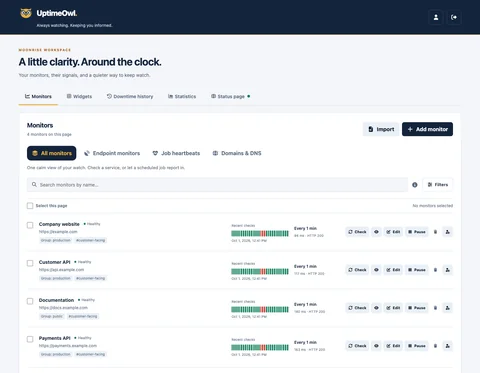
See response times, recent checks, detection history and hourly or daily trends. Use groups and tags to keep your growing watch organized.
A MOMENT FROM EVERYDAY MONITORING
Imagine your health endpoint returns HTTP 200 with {"database":{"connected":false}}. A status-code check alone sees a successful response. Add a JSON rule for database.connected to equal true, and your monitor checks the meaning of the response too.
Protected HTTPS endpoints can use encrypted request headers, Basic authentication or Bearer tokens. Never put credentials into a public monitor name.
FROM FIRST STEP TO STEADY WATCH
Enter the endpoint, give it a clear name and choose an interval allowed by your plan.
Set expected responses and confirmation thresholds. For an API, add the response rules that matter to your service.
Set up Slack or Teams, enable mobile push on your devices, or choose email recipients on a paid plan.
ROOM FOR YOUR WATCH
Free: 3 monitors, checks from 5 minutes · Starter: 10 monitors, checks from 3 minutes · Team: 30 monitors, checks from 1 minute · Business: 100 monitors, checks from 30 seconds. Enterprise allowances are arranged with Blastup.
Slack, Teams and mobile push on every plan. Monitor email alerts on paid plans.
Yes. HTTP(S) monitors support GET, HEAD, POST, PUT, PATCH and DELETE, with request bodies where supported. You can check status codes, response text and JSON values.
Slack, Microsoft Teams and mobile push are available on every plan. Monitor email alerts require a paid plan. Web push and SMS are not available yet.
Your confirmation thresholds determine when failed checks become a downtime incident and when recovery is confirmed. Maintenance can quiet planned interruptions. Email also pauses for a monitor after five incidents in 15 minutes, until it has stayed healthy for 15 continuous minutes.
Visible history depends on your plan. Recent checks, detections and trends help explain interruptions; older history outside your allowance is hidden rather than permanently deleted by the retention policy.
Yes. Choose IPv4 only or IPv6 only in the monitor editor; checks never fall back to the other family. Use two monitors to watch both independently. IPv6 requires a compatible monitoring route. Automatic remains the default.
A HELPING WING
Browse more monitors & detections guides in the help center.