One host. One port.
Check whether a public service accepts a connection. A refused connection or timeout gets the attention it needs.
 UptimeOwl
A SMALL KNOCK. A CLEAR SIGNAL.
A homepage can look perfectly awake while another service stops answering. Give its public TCP port a little lookout of its own, with connection checks and the alerts your team already uses.
Start free. No card required.
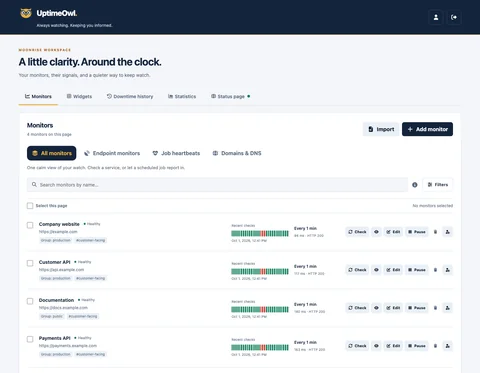
Check whether a public service accepts a connection. A refused connection or timeout gets the attention it needs.
Track the time needed to resolve the host and establish a connection, with one overall timeout.
Use your existing confirmation rules, maintenance windows and notifications. We close the connection without sending application data.
A MOMENT FROM EVERYDAY MONITORING
Your public mail service stops accepting connections after a firewall change. The homepage still loads, so its HTTP monitor stays green. A TCP monitor on the mail service’s port spots the closed door and starts your usual confirmation and alert flow.
An open port is not a complete application health check. Pair it with a protocol-specific monitor when the response matters.
SMALL SIGNALS, EVERYDAY WORK
Watch an already-public mail service’s listening port. This checks connection availability, not message delivery or authentication.
Keep a public service endpoint on watch after deployments and configuration changes.
Notice when your intended public port is no longer reachable from the monitoring worker.
FROM FIRST STEP TO STEADY WATCH
Open Endpoint monitors, add a monitor and choose TCP connection.
Enter a public host and explicit port, then choose an interval, timeout and confirmation rules.
Follow connection timing and confirmed incidents alongside your other monitors.
ROOM FOR YOUR WATCH
Free: 3 monitors, checks from 5 minutes · Starter: 10 monitors, checks from 3 minutes · Team: 30 monitors, checks from 1 minute · Business: 100 monitors, checks from 30 seconds. Enterprise allowances are arranged with Blastup.
Slack, Teams and mobile push on every plan. Monitor email alerts on paid plans.
Yes. It uses your normal monitor allowance and minimum interval. Monitor email alerts require a paid plan; Slack, Teams and mobile push are available on every plan.
No. It confirms that a TCP connection was accepted. It does not validate an application response, login or data transfer.
No. UptimeOwl closes the connection immediately after it is accepted and sends no application data.
No. Keep private services private. This feature checks endpoints that are already intended to be public.
No. Use the TLS monitor for certificates. Use ICMP ping monitoring for IPv4 or IPv6 reachability. TCP checks also support explicit IPv4-only or IPv6-only selection.
Yes. Choose IPv4 only or IPv6 only in the monitor editor; checks never fall back to the other family. Use two monitors to watch both independently. IPv6 requires a compatible monitoring route. Automatic remains the default.
A HELPING WING
Browse more monitors & detections guides in the help center.